This method enables prediction based on a fgpm model, at any given set of
points. Check fgpm for information on how to create fgpm models.
Arguments
- object
An object of class fgpm corresponding to the funGp model that should be used to predict the output.
- sIn.pr
An optional matrix of scalar input coordinates at which the output values should be predicted. Each column is interpreted as a scalar input variable and each row as a coordinate. Either scalar input coordinates (sIn.pr), functional input coordinates (fIn.pr), or both must be provided.
- fIn.pr
An optional list of functional input coordinates at which the output values should be predicted. Each element of the list is interpreted as a functional input variable. Every functional input variable should be provided as a matrix with one curve per row. Either scalar input coordinates (sIn.pr), functional input coordinates (fIn.pr), or both must be provided.
- detail
An optional character specifying the extent of information that should be delivered by the method, to be chosen between
"light"(default) and"full". Light predictions produce a list including the predicted mean, standard deviation and limits of the 95% confidence intervals at the prediction points. Full predictions produce the same information as light ones, in addition to the training-prediction cross-covariance matrix and the prediction auto-covariance matrix.- ...
Not used.
Value
An object of class "list" containing the data structures linked to predictions. For
light predictions, the list will include the mean, standard deviation and limits of the 95% confidence intervals at the prediction points. For full predictions, it will include the same information, plus the training-prediction cross-covariance matrix and the prediction auto-covariance matrix.
See also
* plot.predict.fgpm for the prediction plot of a fgpm model;
* simulate,fgpm-method for simulations based on a fgpm model;
* plot.simulate.fgpm for the simulation plot of a fgpm model.
Examples
# light predictions________________________________________________________________________
# building the model
set.seed(100)
n.tr <- 25
sIn <- expand.grid(x1 = seq(0,1,length = sqrt(n.tr)), x2 = seq(0,1,length = sqrt(n.tr)))
fIn <- list(f1 = matrix(runif(n.tr*10), ncol = 10), f2 = matrix(runif(n.tr*22), ncol = 22))
sOut <- fgp_BB3(sIn, fIn, n.tr)
m1 <- fgpm(sIn = sIn, fIn = fIn, sOut = sOut)
#> ** Presampling...
#> ** Optimising hyperparameters...
#> final  value 2.841058
#> converged
#> The function value is the negated log-likelihood
#> ** Hyperparameters done!

# generating input data for prediction
n.pr <- 100
sIn.pr <- as.matrix(expand.grid(x1 = seq(0,1,length = sqrt(n.pr)),
                                x2 = seq(0,1,length = sqrt(n.pr))))
fIn.pr <- list(f1 = matrix(runif(n.pr*10), ncol = 10), matrix(runif(n.pr*22), ncol = 22))

# making predictions
m1.preds <- predict(m1, sIn.pr = sIn.pr, fIn.pr = fIn.pr)

# checking content of the list
summary(m1.preds)
#>         Length Class  Mode
#> mean    100    -none- numeric
#> sd      100    -none- numeric
#> lower95 100    -none- numeric
#> upper95 100    -none- numeric

# ~R output:~
#         Length Class  Mode
# mean    100    -none- numeric
# sd      100    -none- numeric
# lower95 100    -none- numeric
# upper95 100    -none- numeric

# plotting predictions
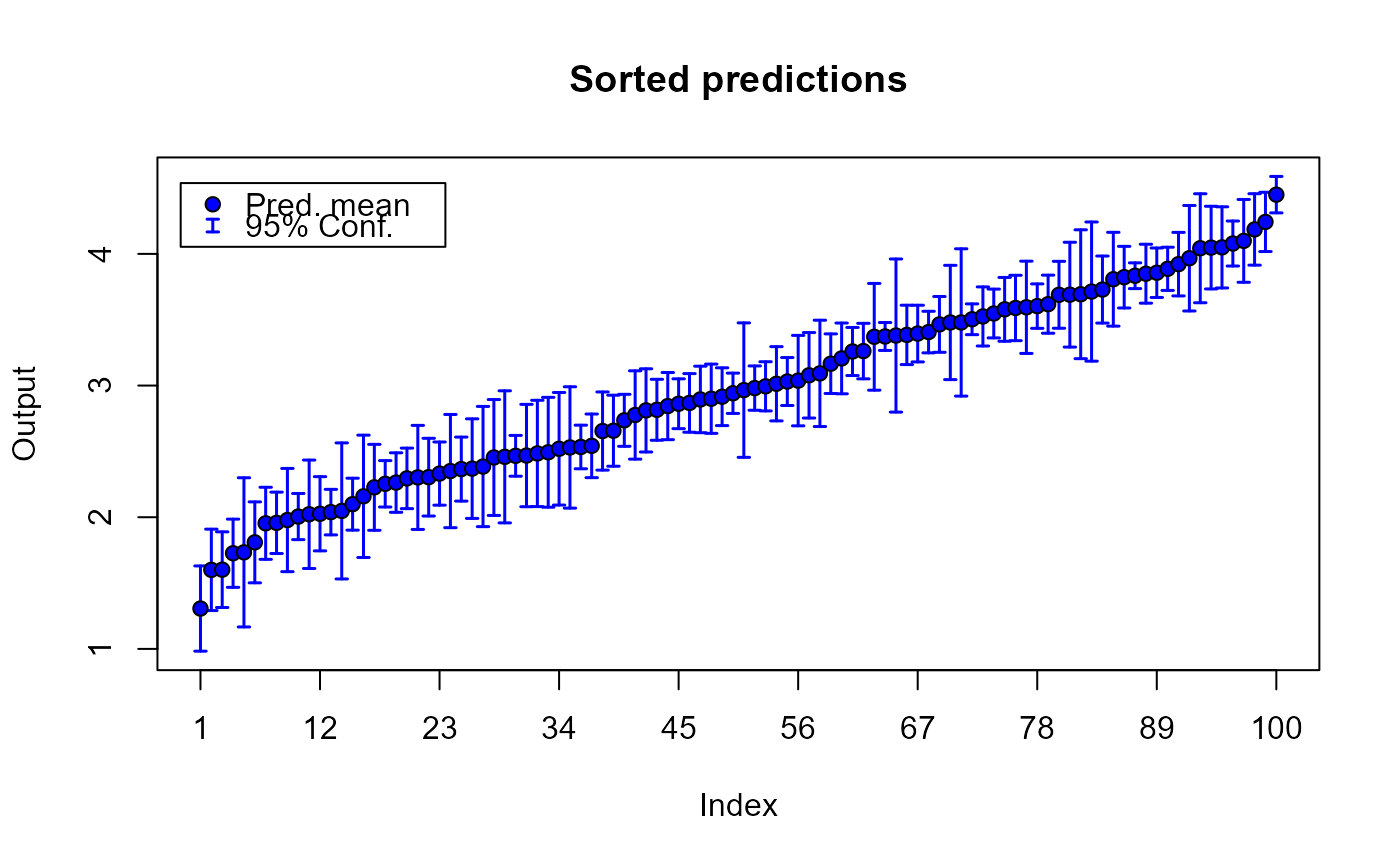
plot(m1.preds)


# comparison against true output___________________________________________________________
# building the model
set.seed(100)
n.tr <- 25
sIn <- expand.grid(x1 = seq(0,1,length = sqrt(n.tr)), x2 = seq(0,1,length = sqrt(n.tr)))
fIn <- list(f1 = matrix(runif(n.tr*10), ncol = 10), f2 = matrix(runif(n.tr*22), ncol = 22))
sOut <- fgp_BB3(sIn, fIn, n.tr)
m1 <- fgpm(sIn = sIn, fIn = fIn, sOut = sOut)
#> ** Presampling...
#> ** Optimising hyperparameters...
#> final  value 2.841058
#> converged
#> The function value is the negated log-likelihood
#> ** Hyperparameters done!

# making predictions
n.pr <- 100
sIn.pr <- as.matrix(expand.grid(x1 = seq(0,1,length = sqrt(n.pr)),
                                x2 = seq(0,1,length = sqrt(n.pr))))
fIn.pr <- list(f1 = matrix(runif(n.pr*10), ncol = 10), matrix(runif(n.pr*22), ncol = 22))
m1.preds <- predict(m1, sIn.pr = sIn.pr, fIn.pr = fIn.pr)

# generating output data for validation
sOut.pr <- fgp_BB3(sIn.pr, fIn.pr, n.pr)

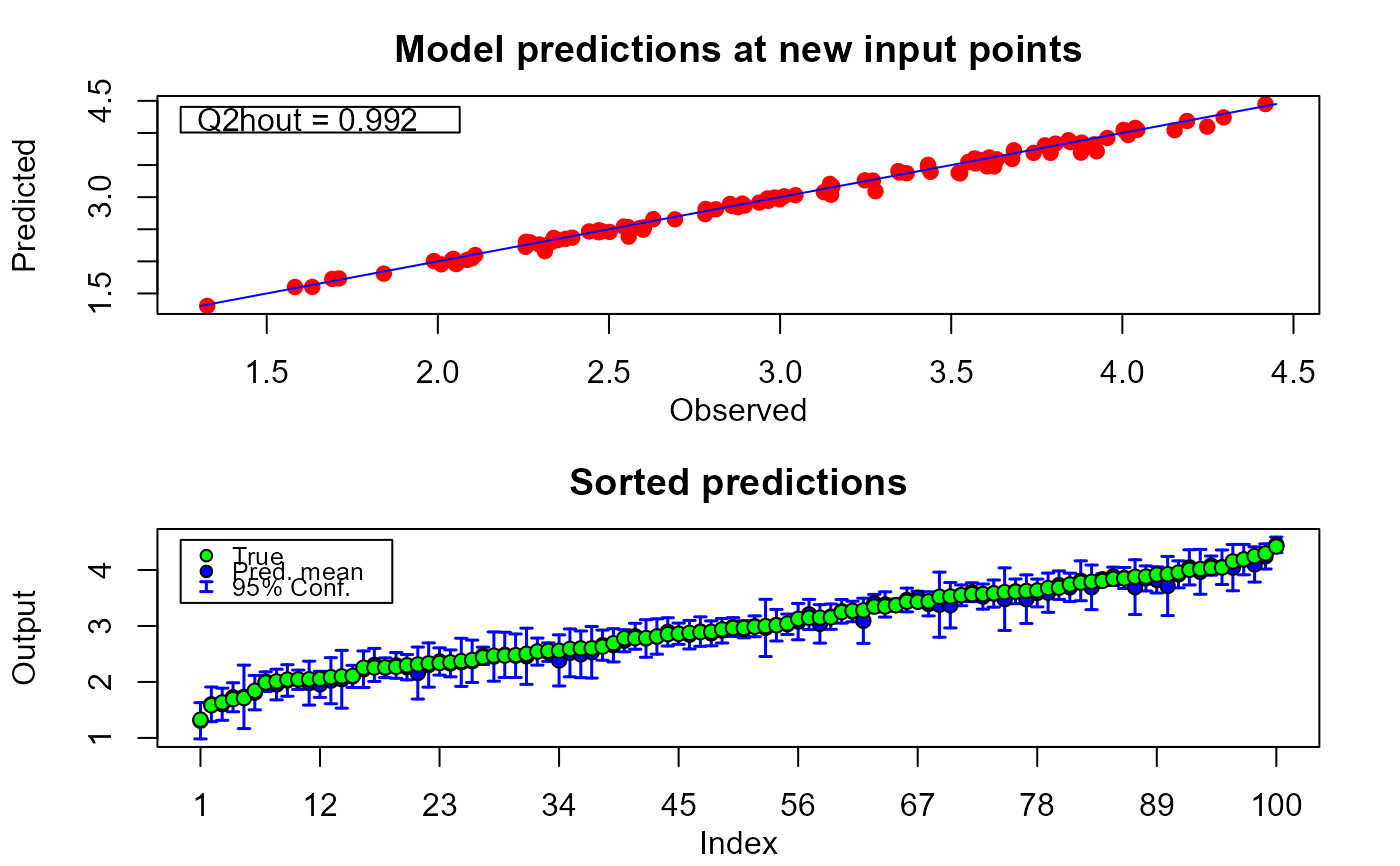
# plotting predictions along with true output values
plot(m1.preds, sOut.pr)


# full predictions_________________________________________________________________________
# building the model
set.seed(100)
n.tr <- 25
sIn <- expand.grid(x1 = seq(0,1,length = sqrt(n.tr)), x2 = seq(0,1,length = sqrt(n.tr)))
fIn <- list(f1 = matrix(runif(n.tr*10), ncol = 10), f2 = matrix(runif(n.tr*22), ncol = 22))
sOut <- fgp_BB3(sIn, fIn, n.tr)
m1 <- fgpm(sIn = sIn, fIn = fIn, sOut = sOut)
#> ** Presampling...
#> ** Optimising hyperparameters...
#> final  value 2.841058
#> converged
#> The function value is the negated log-likelihood
#> ** Hyperparameters done!

# making full predictions
n.pr <- 100
sIn.pr <- as.matrix(expand.grid(x1 = seq(0,1,length = sqrt(n.pr)),
                                x2 = seq(0,1,length = sqrt(n.pr))))
fIn.pr <- list(f1 = matrix(runif(n.pr*10), ncol = 10), matrix(runif(n.pr*22), ncol = 22))
m1.preds_f <- predict(m1, sIn.pr = sIn.pr, fIn.pr = fIn.pr, detail = "full")

# checking content of the list
summary(m1.preds_f)
#>         Length Class  Mode
#> mean      100  -none- numeric
#> sd        100  -none- numeric
#> K.tp     2500  -none- numeric
#> K.pp    10000  -none- numeric
#> lower95   100  -none- numeric
#> upper95   100  -none- numeric

# ~R output:~
#         Length Class  Mode
# mean      100  -none- numeric
# sd        100  -none- numeric
# K.tp     2500  -none- numeric
# K.pp    10000  -none- numeric
# lower95   100  -none- numeric
# upper95   100  -none- numeric

# plotting predictions
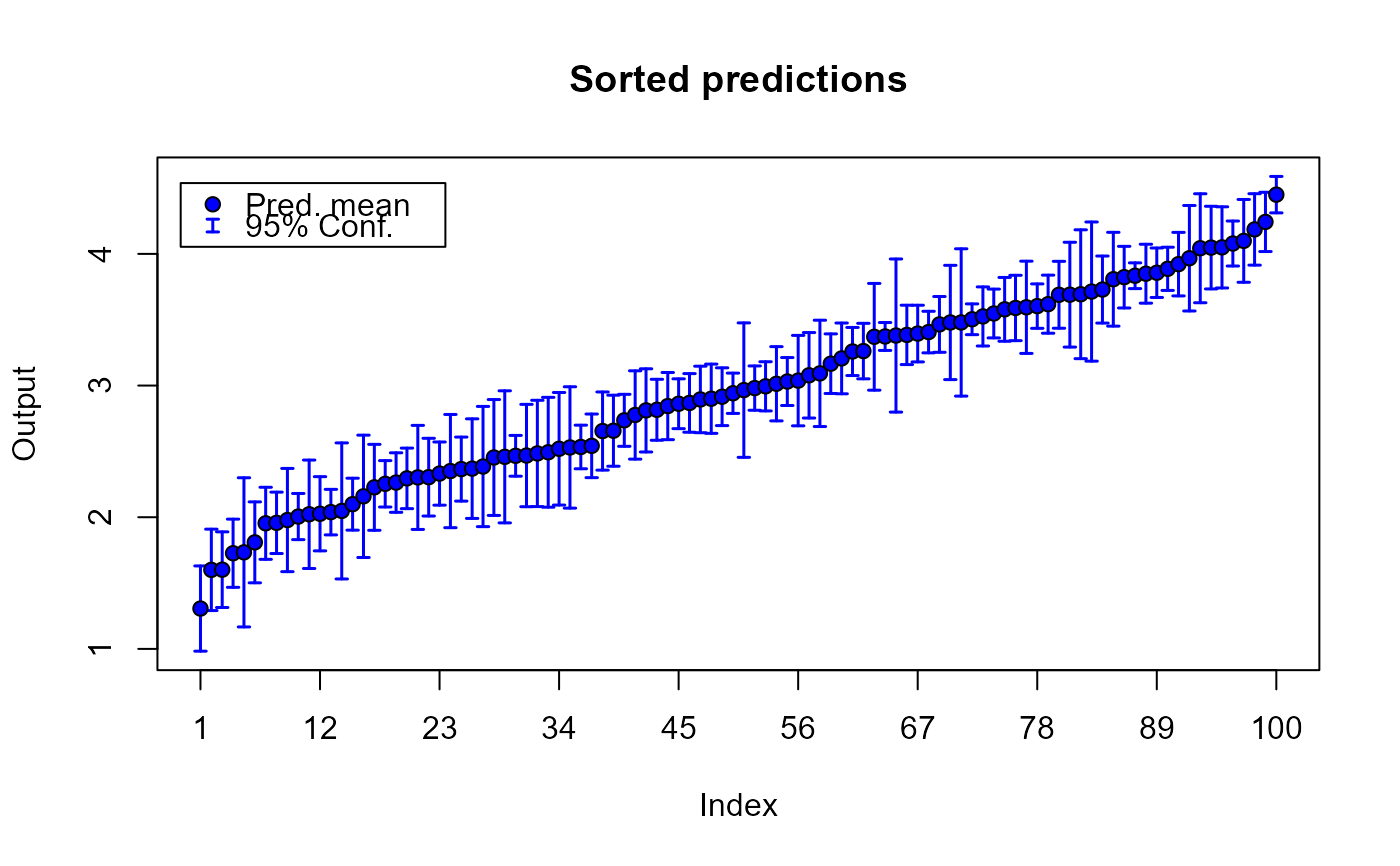
plot(m1.preds)
